__________________________________________
ClimateAP Map Version
Centre for Forest ConservationGenetics
(CFCG)
Department of Forest Science,
University of British Columbia
November 05, 2023
_________________________________________
Contents
About this program
ClimateAP_Map is a ArcGIS
map based version of the standalone MS WindowsÒ
ClimateAP v3.10. It extracts and downscales PRISM (Daly et al. 2002) and
ANUSPLINE 1961-1990 monthly normal data (2.5 x 2.5 arcmin) to scale-free point
data and calculates seasonal and annual climate variables for specific
locations based on latitude, longitude and elevation (optional). The coverage
of ClimateAP includes most part of the Asia Pacific region (Figure 1).
The program uses the scale-free data
as baseline in combination with monthly anomaly data of individual years to
downscale (“Delta method”) and calculate historical monthly, seasonal and
annual climate variables for individual years and periods (decadal and normal
periods) for 1901 - 2022. The monthly anomaly data were calculated based the
dataset from Climate Research Unit (CRU) (Mitchell and Jones 2005) (version
ts4.21). A time-series function allows users to obtain climate data for
multiple years in a single run. With the same approach, ClimateAP also
downscales and integrates future climate datasets for 2020s (2011-2040), 2050s
(2041-70) and 2080s (2071-2100) generated by various global circulation models from the IPCC Sixth
Assessment (AR6). A time-series of annual projections is also
available for the years between 2011-2100. The output of the program includes
both directly calculated and derived climate variables.
Downscaling of
PRISM monthly data including bilinear interpolation and elevation adjustment,
and calculations of climate variables and estimation of derived climate
variables are described in Wang et al. (2017).
For predictions of multiple locations and for more GCMs, we recommend
you to download the standalone version at “https://web.climateap.net/
”.
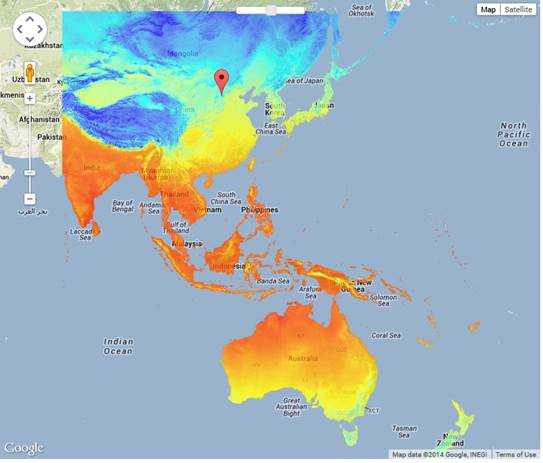
Figure 1. The coverage of ClimateAP
Features
1. Obtain coordinates of a location by
clicking on the map. The values of latitude, longitude and elevation are
generated by Google Map geo-positioning system and Google Elevation Service.
Alternatively, latitude, longitude and elevation can also be input manually.
2. Navigate the map with overlays to
identify the locations of interest.
3. Include historical years and periods
between 1901- 2022 and future periods (2020s, 2050s and 2080s). A large number
of climate variables (see below) can be generated for either a historical period
(a year or a period) or future periods with different climate change scenarios.
4. Save
outputs for multiple locations to a file on your local computer.
Climate
variables
1) Annual variables:
Directly calculated variables:
MAT mean
annual temperature (°C),
MWMT mean warmest month temperature (°C),
MCMT mean coldest month temperature (°C),
TD temperature
difference between MWMT and MCMT, or continentality (°C),
MAP mean
annual precipitation (mm),
MSP mean
summer (May to Sept.) precipitation (mm),
AHM annual heat:moisture index
(MAT+10)/(MAP/1000))
Derived variables:
DD<0 (DD_0) degree-days below 0°C, chilling
degree-days
DD>5 (DD5) degree-days above 5°C, growing
degree-days
DD<18 (DD_18) degree-days below 18°C, heating
degree-days
DD>18 (DD18) degree-days above 18°C, cooling
degree-days
NFFD the
number of frost-free days
PAS precipitation
as snow (mm) between August in previous year and July
in current year
EMT extreme
minimum temperature over 30 years. For an individual year, the EMT is estimated
for the 30-year normal period where the individual year is centred.
EXT extreme
maximum temperature over 30 years. For an individual year, the EXT is estimated
for the 30-year normal period where the individual year is centred.
Eref Hargreaves
reference evaporation
CMD Hargreaves
climatic moisture deficit
2) Seasonal variables:
Tave_wt winter (Dec.(prev. yr) - Feb.) mean
temperature (°C)
Tave_sp spring (Mar. - May) mean
temperature (°C)
Tave_sm summer (Jun. - Aug.) mean
temperature (°C)
Tave_at autumn (Sep. - Nov.)
mean temperature (°C)
Tmax_wt winter mean maximum
temperature (°C)
Tmax_sp spring mean maximum
temperature (°C)
Tmax_sm summer mean maximum
temperature (°C)
Tmax_at autumn mean maximum
temperature (°C)
Tmin_wt winter mean minimum
temperature (°C)
Tmin_sp spring mean minimum
temperature (°C)
Tmin_sm summer mean minimum
temperature (°C)
Tmin_at autumn mean minimum
temperature (°C)
PPT_wt winter precipitation
(mm)
PPT_sp spring precipitation
(mm)
PPT_sm summer precipitation
(mm)
PPT_at autumn precipitation
(mm)
3) Monthly variables
Tave01 – Tave12 January - December mean temperatures (°C)
Tmax1 – Tmax12 January - December maximum mean
temperatures (°C)
Tmin01 – Tmin12 January - December minimum mean
temperatures (°C)
PPT01 – PPT12 January
- December precipitation (mm)
DD_0_01 – DD_0_12 January - December degree-days below 0°C
DD5_01 – DD5_12 January - December degree-days above 5°C
DD_18_01 – DD_18_12 January
- December degree-days below 18°C
DD18_01 – DD18_12 January
- December degree-days above 18°C
NFFD01 – NFFD12 January - December number of frost-free
days
PAS01 – PAS12 January – December
precipitation as snow
Eref01 – Eref12 January – December Hargreaves reference
evaporation
CMD01 – CMD12 January – December Hargreaves climatic
moisture deficit
How to refer
Wang, T., G. Wang, J. L. Innes, B.
Seely and B. Chen, 2017. ClimateAP: an application for dynamic local
downscaling of historical and future climate data in Asia Pacific. Front. Agr. Sci. Eng. 4 : 448-458, Open
access at:
https://doi.org/10.15302/J-FASE-2017172
Acknowledgements
Funding for this
study was provided by the APFNet (www.apfnet.cn).